
Fine-tuning LLaVA for Scientific and Chart-Based Visual Question Answering
Introduction
LLaVA (Large Language and Vision Assistant) is a multimodal model developed by connecting a visual encoder with a language model for comprehensive visual and language understanding. Built to interpret complex vision-and-language instructions, LLaVA incorporates GPT-4-generated multimodal instruction data to address a wide range of visual understanding tasks, achieving state-of-the-art performance in visual question answering (VQA). Our project focuses on fine-tuning LLaVA for scientific visual content, including image data from research and scientific charts, to enhance its capabilities for scientific analysis and chart-based questions.
Social Impact: Adapting LLaVA to scientific domains enables researchers, educators, and students to efficiently extract insights from complex visual data. This advancement supports broader knowledge accessibility, empowering users to query scientific visualizations with natural language, accelerating innovation, and democratizing access to technical expertise.
Methodology
This project employs a structured approach to fine-tune LLaVA on scientific and chart-based visual datasets, with a focus on adapting its multimodal reasoning capabilities for scientific applications.
Data Collection and Preparation
My contributions involved gathering relevant scientific datasets, including the Science QA benchmark and additional datasets from sources such as Kaggle, which provided scientific documents and visuals. The Science QA dataset consists of 21,208 multimodal multiple-choice questions across natural sciences, language science, and social science, with explanations and lectures for chain-of-thought reasoning. My partner focused on biomedical data collection to enrich the model’s capabilities in that domain.
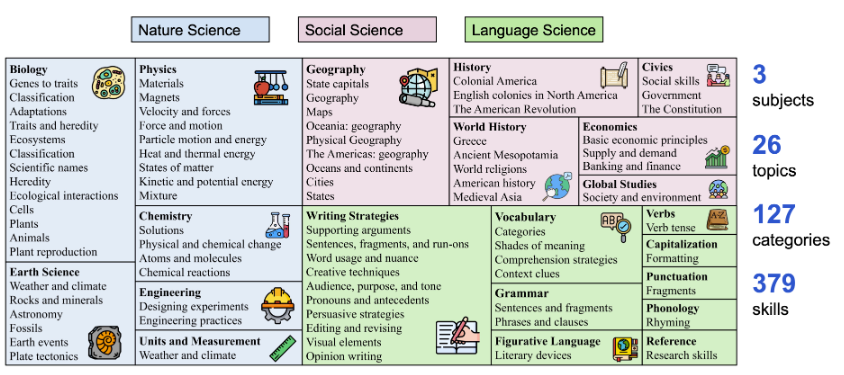
Figure 1: Science QA covers a wide range of subjects, including natural sciences, social sciences, and language sciences, enhancing the model’s ability to generalize across topics.
Model Training
The LLaVA model training includes two primary stages:
- Pre-training: LLaVA was pre-trained on general vision-language datasets to align image features with language representations. We utilized filtered CC3M and custom instructional data for alignment.
- Fine-tuning on Science QA: LLaVA was then fine-tuned using Science QA’s question-and-answer pairs, formatted in a conversation style for visual reasoning. The chain-of-thought approach in Science QA helped the model build reasoning processes crucial for scientific questions.
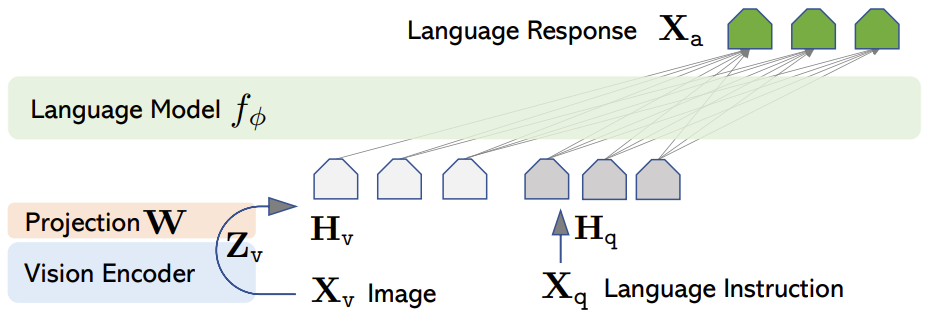
Figure 2: The LLaVA architecture.
Results
The fine-tuned LLaVA model achieved significant improvements on the Science QA dataset:
- Accuracy: Our fine-tuned LLaVA model reached an accuracy of 92.53% on Science QA, surpassing previous benchmarks and illustrating its effectiveness in answering complex scientific questions.
- Chart Reading Capability: Initial tests on sample scientific charts indicate that LLaVA can interpret and answer questions about data trends, specific values, and other features of visualized data.
- Multimodal Reasoning: The chain-of-thought approach in Science QA notably enhanced the model’s performance in multimodal reasoning tasks, indicating a robust understanding of context within scientific images.
Discussion and Future Directions
This project demonstrates the feasibility of adapting LLaVA for specialized scientific tasks, providing new avenues for scientific and educational applications. The model’s ability to handle chart-based questions paves the way for its use in data-driven fields requiring visual analysis.
Future Work:
- Enhancing LLaVA’s capabilities for biomedical data, allowing domain-specific queries in medicine and biology.
- Evaluating its performance on larger, more diverse datasets of scientific imagery to refine its applicability across various research disciplines.